|
What is Corneal Topography?
|
|
Corneal topography is the technique by which exact physical
features and curvature of corneal surface are measured and graphically represented. Clinicians have long recognized the importance
of the refractive qualities of the cornea. It is clear that the regularity of curvature of the cornea affects the eyes ability
to bend light and, therefore visual performance.
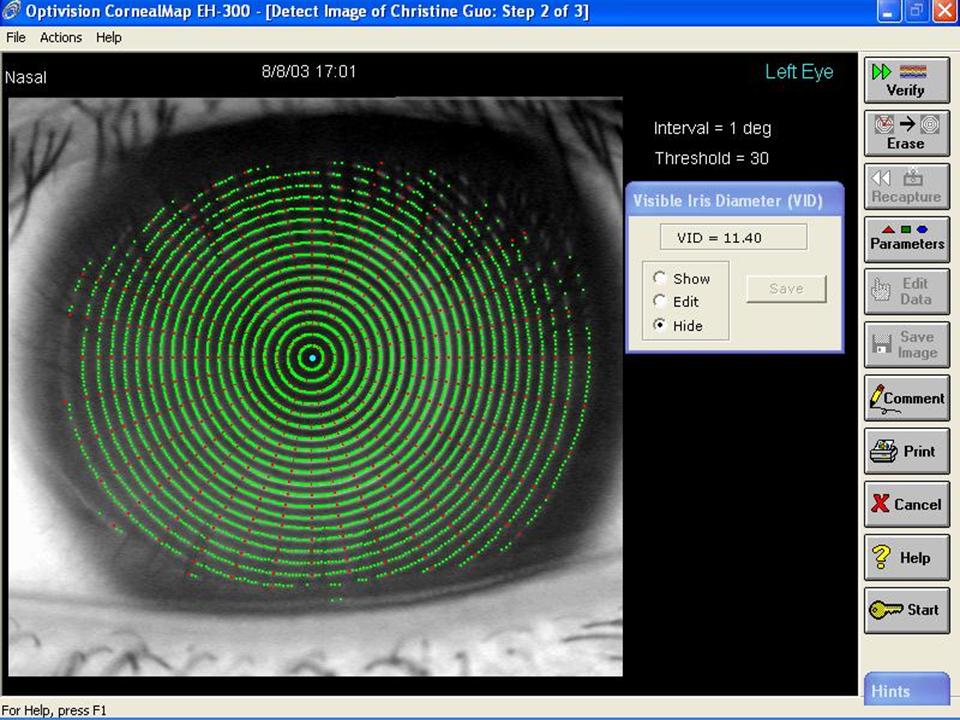
The importance of accuracy and sensitivity in corneal detection
The usefulness of corneal maps is directly related to their accuracy. Unless the data is accurate, a map is nothing but
a colorful picture. Detection of reliable data is the most important aspect of any corneal topographer. Incorrect data will
lead to the loss of valuable information and missed diagnosis and continued patient complaints but multiple return examination
visits at the doctors expense. The more sensitive and accurate is the detection system, the more reliable the corneal information,
and the better the patient care.
Some corneal topography companies state that all of the detection systems are equivalent
and that the major difference is in the software. This is a false statement. Detection systems vary widely, and this has been
demonstrated by numerous studies involving different manufacturers systems. If a system cannot detect small corneal irregularities
such as excimer central islands, refractive incisions, corneal warpage, or micro irregular astigmatism, then the ability to
properly screen patients is impaired.
|
|
Two
methods of corneal detection
There are two different types of illuminated Placido rings and, therefore, two different
methods of corneal data detection for a manufacturer to incorporate into the topographer. The cone of a particular system
either consists of a small number of broad-band rings or larger number of fine, thinner rings. System designed with the thicker
rings use the edge-detection method of data collection, whereas those incorporating the narrow rings use the peak detection
method.
|
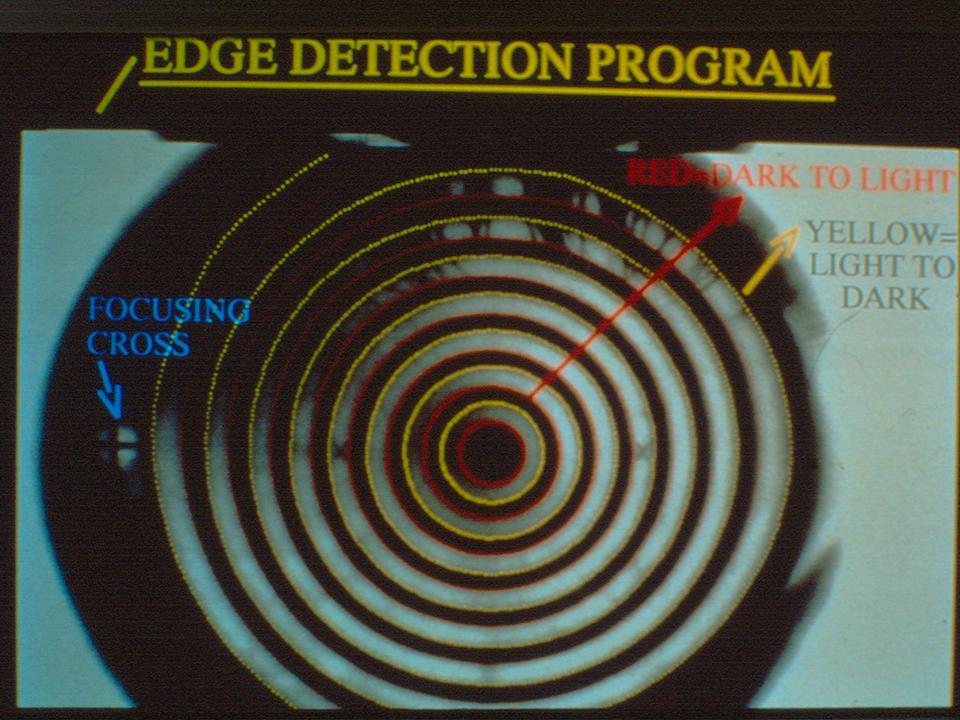
Edge
versus peak detection
Edge detection works by locating the transition between the dark and light areas of the image.
If the image is well focused, the distinct edges area easily detected, and the method works. However, if the captured image
is out of focus, the actual position of the data point is not easily discernable and often skewed. The broader rings are not
sensitive to small detail, which can mask and smooth over small areas of pathology.
The Optivision CornealMap EH-300 incorporates
the peak detection system, which works by producing a spike representing the intensity of each illuminated ring. The computer
software always locates the peak of each illumination spike and positions the data point precisely at that brightest point.
Because of the increased number of rings, this newer configuration which highlights and detects discrete areas of pathology
often missed by other systems, gathers more data and is more sensitive to small changes on the corneal surface.
|
|
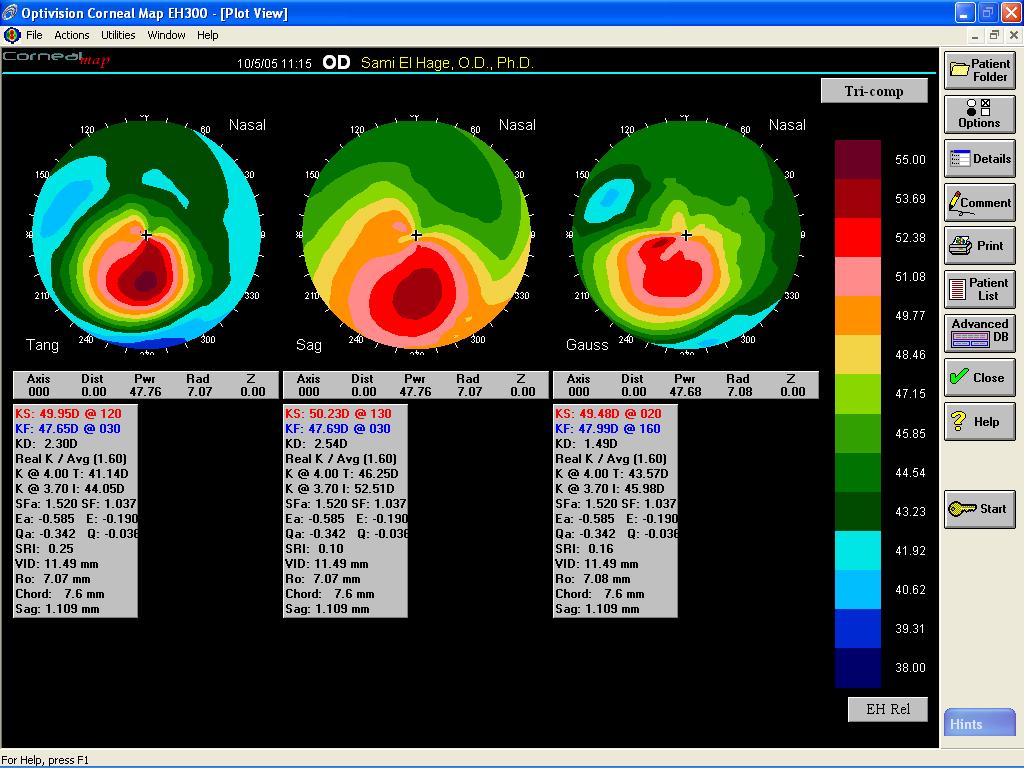
Tangential,
Sagittal and Gaussian Computations
Three different algorithms are used to determine dioptric power of the cornea.
|
The tangential computation, also referred to as instantaneous
rate of curvature, shows corneal curvature at a location, free of the optical axis, without the assumption that the location
in question is on sphere. This best depicts the physical corneal shape and is very sensitive in allowing detection of subtle
abnormalities in the corneal surface.
The sagittal computation, also referred to as an axial solution, makes the crude
assumption that the entire corneal optical surface has a single center of curvature, which corresponds with the primary map.
This assumption is that each location is on a spherical surface. However, the cornea is an aspheric surface on which algorithms
result in a flatter or steeper, smoother representation of the corneal surface, power, and its optical performance. The sagittal
power is sensitive to the position of the optical axis.
The Gaussian computation estimates the principal radii of
curvature at each measurement point. Measurements on adjacent radials as well as those along the same radial contribute to
the Gaussian computation. This gives a two-dimensional solution which can reproduce power values independent of the videokeratographic
axis. The Gaussian computation is augmented by a cylinder vector field indicating the magnitude and direction of cylinder
at each data point on the plot.
|
|
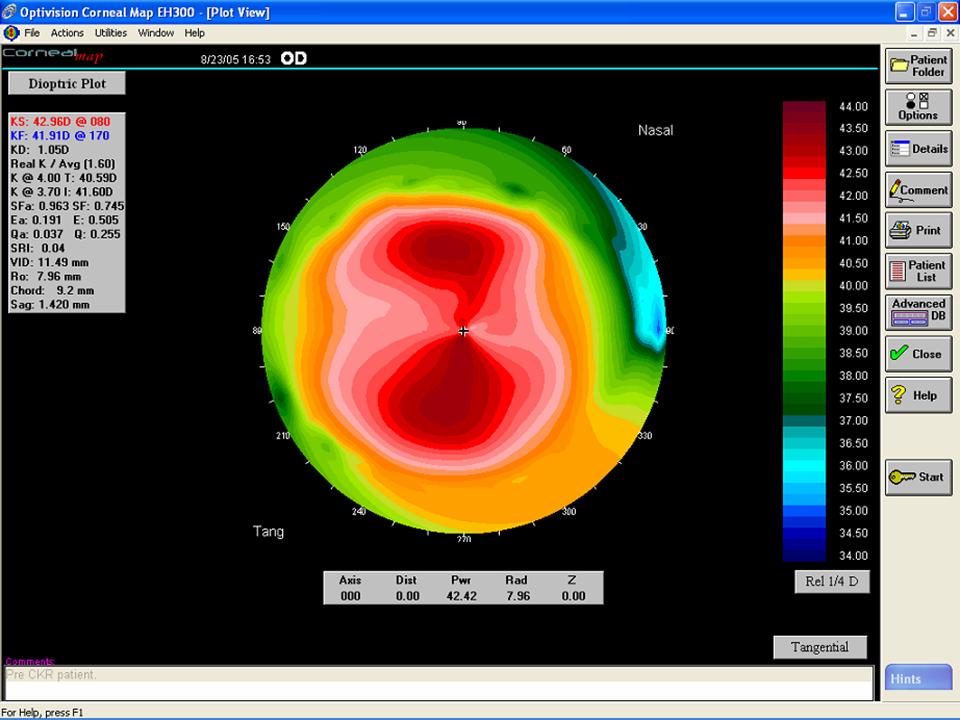
Difference
between relative and absolute scales
When analyzing color topographic maps, it is very important to be aware of whether
the scale is relative or absolute. A relative scale is patient-specific and has its end points defined by the particular map
being examined. The highest values receive red and orange or hot colors, while the lowest values receive blue and green or
cold colors. The colors enhance the steep and flat areas, resulting in a better contrast.
The example plots show the
same corneal surface displayed using the relative and absolute scales with varying step ranges. Note central steep area and
the peripheral flattening demonstrating an aspheric shape of the cornea.
|
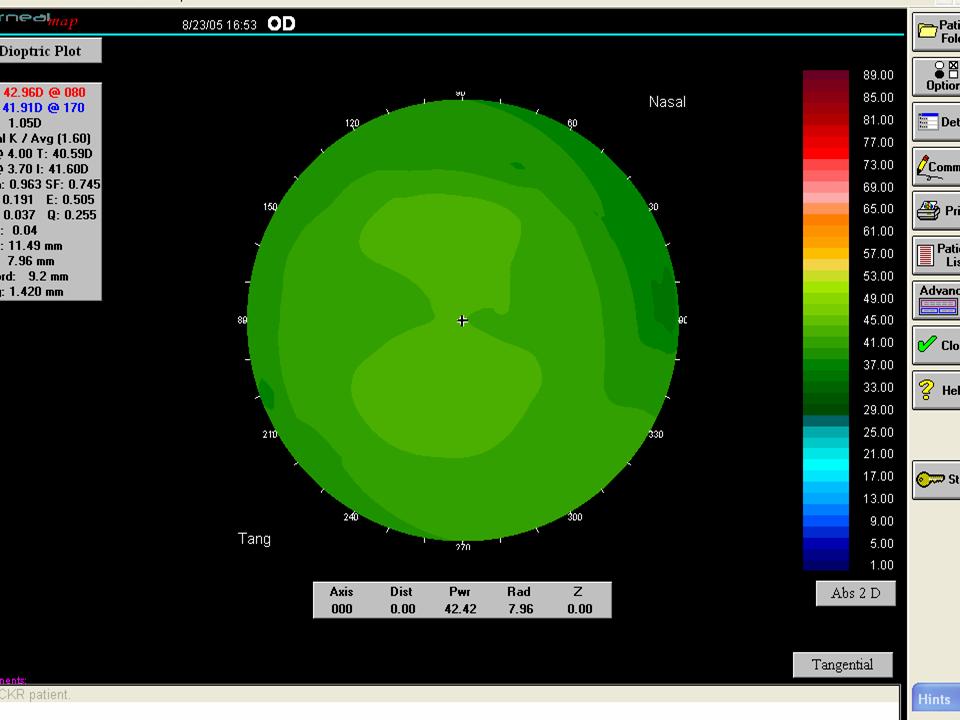
An
absolute scale takes a predetermined centerpoint, ie, 45D, and evenly distributes the colors across the scale. As a result,
an average cornea with little variation will not display wide range of colors. The recommended scale to use when comparing
two images to demonstrate repeatability is the absolute ½ or one diopter scales. Using smaller dioptric steps will exaggerate
the differences between the images. Larger steps will cause important information to be smoothed over.
|